Then there is the unspoken truth and every parent of a daughter has had that moment — silent, sitting on the couch after a birthday party with your friend looking at your child wondering are they growing in the right way. Is she too tall? Too short? Underweight? Heavier than the others? The charts at the paediatrician's office help, but they are confusing and do not tell the full story.From Age-To-Height & Weight Chart For Girls Here we will take you through the entire height and weight chart for girls according to age — new born till late teens — written by, reviewed by our dermatology team at VK Allure Dermaclinicin Chennai.
In all our Kilpauk and ECR Uthandi clinics, we've seen enough teenage girls dealing with the downstream impacts of becoming a woman — stretch marks, acne, body-image anxieties around their weight at 13-14 years old — to know this isn't an intellectual issue. At 8 years old, where a young girl lies on a chart has scant relation to where she will lie at 28. But the trends, they are an observation worth keeping an eye on. And when that time comes, the timing of action is important.
The short version
The growth of Indian girls is predictable: rapid gain in the first 4-5 months, a steady rise from childhood till puberty (Puberty refers to genital changes) with a peak height spurt occurring between 9 and 13 years, followed by adult height by about age 16. An average Indian adult female is height around 152–158 cm and weight between 50–60 kg. No one chart reading will diagnose anything — what ultimately matters is if your daughter is following her own curve over time, and whether her BMI sits somewhere between the 5th and 85th percentile for her age.
Why this matters (and why a single number rarely does)
Growth charts- The fake news doctors believe get a lot more respect than its been given parents That is likely because parents type in one line — 'my daughter at 7 years old' — and either feel comforted or terrified. However, paediatricians will consider the whole curve. They follow a girl from, oh, say 2 to 4 to 6 and check in on her trajectory: Is she steady? That's the real question. Or that a girl who has been on the 25th percentile her whole life is fine. If a girl was on the 75th percentile last year and is now the 25th, that's something you should talk about.
Thus, this article provides two things for you. Firstly, the actual numbers — organiced by the age band with averages from both WHO and ICMR standards so you can judge on where Indian girls track against global references. Second, context: normal variation vs red flag; when to ask for care; how childhood growth quietly influences adult health.
One more upfront note. We are a dermatology and aesthetics practice, not a pediatric practice. If its strictly paediatric: major growth failure, reasonable suspicion of a hormonal disorder, anything you feel requires a specialist — see a career paediatrician or career paediatric endocrinologist first. We do, indeed, address adolescent dermatologic disorders that accompany development: acne associated with puberty, melasma pregnancy mask postpartum pigmentation stretch marks from rapid increasement and growth. We will highlight where that is relevant.
Height and weight chart for girls — newborn (0 to 12 months)
The first year of life is when a human grows faster than any other time. By approximately 5 months, a healthy newborn will have doubled her birth weight; she will have tripled it by 12 months. In the first year she will grow about 25 cm in length, which means if it would continue like that she'd be over 200 cm tall by school age. (Thankfully it doesn't.) growth standards used in clinical practice Database for infants is mostly from the WHO Multicentre Growth Reference Study, which included Indian children in the 6-country cohort.
| Age | Average Weight | Average Length / Height |
|---|---|---|
| Newborn | 3.2 kg | 49.1 cm |
| 1 month | 4.2 kg | 53.7 cm |
| 2 months | 5.1 kg | 57.1 cm |
| 3 months | 5.8 kg | 59.8 cm |
| 4 months | 6.4 kg | 62.1 cm |
| 6 months | 7.3 kg | 65.7 cm |
| 9 months | 8.2 kg | 70.1 cm |
| 12 months | 8.9 kg | 74.0 cm |
Mid-percentile (50th) values for baby girls. Source: WHO Child Growth Standards.
Height and weight chart for girls — toddler & pre-school (1 to 5 years)
And this is completely normal; growth slows down significantly after baby turns 1 year old too. Some toddlers will appear to hardly grow for months, before shooting up a centimetre and a half over night. The following chart uses ICMR aligned averages for Indian girls, which run a few points below the WHO global numbers as that reflects the true distribution we see in our paediatric clinics in India.
| Age | Average Weight | Average Height |
|---|---|---|
| 1 year | 8.9 kg | 74.0 cm |
| 18 months | 10.2 kg | 80.7 cm |
| 2 years | 11.5 kg | 86.4 cm |
| 2.5 years | 12.7 kg | 91.4 cm |
| 3 years | 13.9 kg | 95.1 cm |
| 4 years | 16.1 kg | 102.7 cm |
| 5 years | 18.2 kg | 108.9 cm |
Mid-percentile values for Indian girls aged 1–5. Source: ICMR/IAP reference standards.
One of the biggest concerns at this age: my toddler is not eating Check Out that syphilis not the dinner tabletop. Most toddlers are remarkably good at self-regulating their intakes - they'll eat loads on growth-spurt days and barely anything for a week afterward. That food fight is not worth having, if she is on her curve and full of beans. Of course having dropped a percentile band and being lethargic is another matter.
Height and weight chart for girls — school age (6 to 10 years)
This is the steady-growth phase. Girls in India gain approximately 2-3 kg each year (between ages of 6 and 10) and grow 5-7 cm per annum. You have almost none of the dramatic change you saw in your infant self or the one coming in puberty. Now, two observations in this stage: quality of nutrition (this is when fussy eating habits set in for long years) and weight gain driven by screen-time; both these challenges are far more apparent now than they were a decade ago in the practice of Chennai paediatrics.
| Age | Average Weight | Average Height |
|---|---|---|
| 6 years | 20.4 kg | 115.0 cm |
| 7 years | 22.9 kg | 121.0 cm |
| 8 years | 25.7 kg | 127.0 cm |
| 9 years | 28.5 kg | 132.5 cm |
| 10 years | 31.9 kg | 138.0 cm |
Mid-percentile values for Indian girls aged 6–10. Healthy range typically spans ±3 kg and ±5 cm around these averages.
Anecdotal evidence from a clinic: the 2026 Indian girl-child is taller and more heavyweight than her mother at that age. Improved diets, less infections, higher levels of protein and dairy in the diet. That's good. She is also less active; sleeps fewer hours and more screen time. The two trends pull growth in different directions — greater height but also increased weight-for-height than by the previous generation. It matters quite a bit more for her 40-year cardiovascular health than how she looks at age 10.
Height and weight chart for girls — pre-puberty and puberty (11 to 14 years)
And this is where the chart suddenly gets interesting — it stop being predictable. Girls now go through puberty between the ages of 9 and 11, with the biggest growth spurt taking place 6–12 months before menstruation (the first period or menarche) occurs. For urban Indian girls, the average age of menarche has dropped in the last 20 years — from 13.5 years about a generation ago to just above 12.4 now. That's a true turnaround, if you will, fueled by improved nutrition in conjunction with greater body fat — and also it makes the chart's observed upsurge heretofore to be interpreted differently.
| Age | Average Weight | Average Height |
|---|---|---|
| 11 years | 36.9 kg | 144.0 cm |
| 12 years | 41.5 kg | 149.8 cm |
| 13 years | 45.8 kg | 156.7 cm |
| 14 years | 49.4 kg | 158.7 cm |
Mid-percentile values for Indian girls aged 11–14. Range widens significantly during these years.
A twelve-year-old could feel as mature as a sixteen-yer-person. One is 158 cm tall, has just had her first period; the other is 144 cm and still pre-pubertal. Both are normal. It is hormone-triggered and there is biological bandwidth both sides of the average.
This is also the phase where parents start to bring concerns about acne, stretch marks from rapid growth, and early pigmentation into the dermatology clinic. Stretch marks on the outer thighs, hips, and lower back are normal in a fast pubertal spurt — they fade over time but can be treated more effectively when they're still pink/red rather than after they've turned silvery white.
Height and weight chart for girls — mid to late teens (15 to 18 years)
At age of 15, most Indian girls have completed — or are close to completing — their height development. The chart flattens. There is some growth that continues (predominantly in muscle mass, bone density and body composition—not length). The last 2–4 cm of height typically occurs after menarche but before age 16, by which time growth plates have closed and adult height is determined.
| Age | Average Weight | Average Height |
|---|---|---|
| 15 years | 52.1 kg | 159.7 cm |
| 16 years | 53.5 kg | 160.4 cm |
| 17 years | 54.4 kg | 160.8 cm |
| 18 years | 55.0 kg | 161.0 cm |
Mid-percentile values. Adult female height in India ranges roughly 152–166 cm depending on regional and genetic factors.
This is the stage at which issues about weight actually begin to appear in our facility. Body-image anxiety peaks in mid-adolescence, and teenage girls growing up in Chennai are not shielded from the same Instagram-led ideal-of-body pressures as anyone else. At one end of the spectrum, there are girls restricting food and requiring input from a paediatrician, and at the other a slim girl who has put on considerable weight since the pandemic years and needs help with her body composition. Neither should be treated like an adult — both require cautious assessment beforehand.

How to read these charts properly — percentiles, not averages
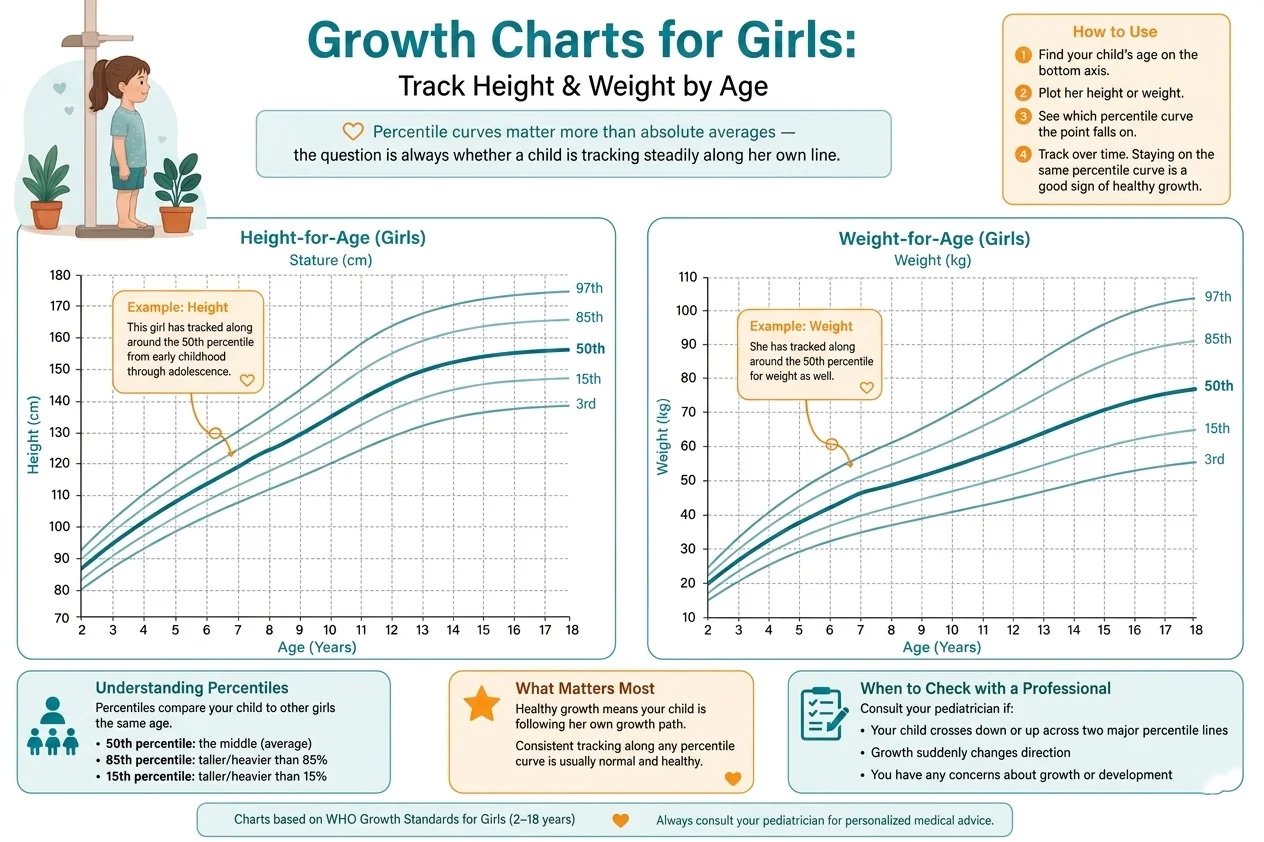
All numbers in the tables above is 50 percentile values — that means the middle of distribution. They are not "ideal" or "target" numbers. So the 50th percentile is literally just the line where half of normal girls are above it and half below. A girl whose weight is on the 25th percentile, is completely healthy A 90th percentile girl is completely healthcare. This chart is not a goal of the individual, this is a population portrait.
Instead, paediatricians plot your daughter on a percentile curve — a graph with age along the bottom axis and weight (or height) up the side, with curves running across at 3rd, 10th, 25th, 50th, 75th, 90th and better than that. Your daughter's data points should roughly trace one of these curves over time. The clinical concern starts when:
- She is consistently below the 3rd percentile (formally "failure to thrive" territory)
- She drops two or more percentile bands over a relatively short period
- Her BMI persistently sits above the 85th percentile (overweight) or 95th (obese) for age
- Her height curve flattens for over a year without an explanation
None of these patterns can be read from a one-off measurement. Which is why your paediatrician will probably shrug at any single reading and ask to see the trend.
BMI for girls — and why adult BMI charts don't apply
The adult BMI cut-offs are easy, less than 18.5 for underweight, 18.5–24.9 normal, 25–29.9 overweight and greater than30 for obese NOTE: These numbers don't apply to kids and teens. BMI naturally increases during childhood for a growing girl, then they fall around age 5–6 and (often) rise again at the outset of puberty. Now her healthy BMI at 8 is different from her healthy BMI at 14 and both are different to a healthy adult Bmi.
Instead, paediatricians use BMI-for-age percentiles. The rough categories the IADVL and Indian paediatric bodies use are:
- Below 5th percentile: underweight
- 5th to 85th percentile: healthy weight
- 85th to 95th percentile: overweight
- Above 95th percentile: obese
Above the 85th percentile in childhood is the early signal — not because a high-BMI child is unhealthy today, but because the trajectory often continues into adulthood. Indian children specifically are at higher cardiometabolic risk at lower BMI levels than European children, which is why the ICMR recommends earlier intervention thresholds for Indian populations. That's not us saying it — that's the published consensus.
The Indian context — climate, diet and genetics matter
Global charts (WHO especially) treat all children as one cohort. ICMR charts are India-specific, and they show consistent differences worth understanding. Indian girls, on average, are 2–4 cm shorter at every age beyond infancy than the WHO 50th-percentile reference. That is not pathology — it's the genuine distribution.
Why? A combination of genetics, historical undernutrition (which affected the previous generation's growth and therefore the gene pool), regional climate, and dietary patterns. South Indian girls are typically 1–2 cm shorter than North Indian girls of the same age, and East Asian girls are taller still. None of this is "better" or "worse" — it's distribution. The clinically useful question is always: where is this particular girl on her curve, relative to her parents' heights, her sibling's growth, and her own previous measurements?
There's a simple parental-height calculation that can estimate a girl's final adult height: subtract 13 cm from her father's height in cm, add to her mother's height, and divide by 2. That gives a target adult height ±5 cm. It's not a precise prediction — but it puts the chart into family context. A girl tracking on the 25th percentile with two short parents is exactly where she should be.
What the chart doesn't tell you
A height and weight chart tells you almost nothing about body composition. A girl could be on the 50th percentile for weight and be carrying too much visceral fat. Another could be at the 90th percentile and be muscular and athletic. Two girls of identical height and weight can have very different metabolic profiles. The chart is a screening tool, not a diagnostic one.
The chart also says nothing about:
- Bone density. A critical concern for girls — 90% of peak adult bone mass is laid down by age 18. Calcium and vitamin D intake during teen years determine osteoporosis risk decades later.
- Iron status. A girl with menstrual periods needs roughly twice the iron intake of a boy the same age. Iron deficiency is widespread among Indian teen girls and a major hidden cause of fatigue, poor concentration and slowed growth.
- Hormonal patterns. Whether her periods are regular, whether she's developing on schedule, whether her skin and hair patterns are normal.
- Mental health. Body-image concerns, disordered eating patterns, and pressure from peers and social media — none show up on a chart, but they shape behaviour around food and exercise more than the numbers do.
When to actually worry — and when to call a specialist
The most useful guidance any paediatrician can give: trust the trend, not the snapshot. That said, here are concrete signals that justify a specialist consult.
Red flags for growth concerns
- Height consistently below the 3rd percentile from age 2 onward
- A drop of two or more percentile bands in either height or weight over 6–12 months
- No height growth for over a year between ages 4 and 10
- Signs of puberty before age 8 or after age 14
- Final adult height projection more than 8 cm below mid-parental height
Red flags for weight concerns
- BMI persistently above the 85th percentile from school age onward
- Rapid weight gain without dietary change
- Dark velvety patches at the neck or armpits (acanthosis nigricans — an early insulin resistance sign)
- Skipped or irregular periods in a teen with high BMI
- Signs of disordered eating — food restriction, binge episodes, body-image distress
Any of these patterns deserves a paediatrician's input first. From there, you may be referred to a paediatric endocrinologist, an adolescent gynaecologist, a dietician, or a specialist in adolescent dermatology depending on the picture.
How VK Allure approaches adolescent and young-adult women
Most of our adolescent patients are 14 and older — by which point major growth concerns are typically settled. What we see, in roughly this order: teen acne and acne scars, stretch marks from growth spurts and rapid weight changes, hormone-linked pigmentation, unwanted facial and body hair, and weight management questions in young adult women.
For weight management in women over 18 who have completed their growth, we offer medically supervised programmes through our weight loss, inch loss therapy, EMS muscle stimulation and cool sculpting services. None of these are appropriate for actively-growing teens. For our adult patients, the standard protocol involves BMI assessment, body composition analysis, lifestyle review, and only then a personalised plan. We don't crash-diet anyone.
For families with adolescent dermatological concerns, our consultations at the Kilpauk and ECR Uthandi branches include the parent in the conversation. We don't treat teenage girls in isolation, and we don't pretend to be a substitute for paediatric care — we coordinate with paediatricians and gynaecologists where the case requires it.
Practical advice for parents — what actually helps growth
1. Sleep is non-negotiable
Growth hormone is released in pulses during deep sleep, especially in the first half of the night. School-age girls need 9–11 hours; teens need 8–10. A daughter chronically sleeping 6 hours because of homework or screen time is paying for it in growth — visibly or invisibly.
2. Protein and calcium at every meal
Indian diets traditionally underweight protein, and that's especially true for vegetarian households relying on cereals. A girl needs roughly 1 g of protein per kg of body weight daily during growth years. Practical sources: a glass of milk, an egg, a serving of dal, a small piece of paneer or fish at each main meal.
3. Movement, not exercise
Structured exercise classes are fine but unnecessary for growing children. What matters is total daily movement — climbing stairs, walking to school where possible, after-school games. Indian urban children, especially girls, are now among the most sedentary in the world. This is a fixable problem at the family level.
4. Sun exposure for vitamin D
Indian girls are systematically vitamin D deficient. 15–20 minutes of midday sun exposure on arms and face, 3–4 times a week, makes a meaningful difference. If she's avoiding the sun completely (school timings, indoor lifestyle), a paediatrician-prescribed supplement is the answer — not a guess.
5. Watch the relationship with food
By age 11 or 12, most Indian girls have been told something about their body by someone — a relative, a classmate, a coach, social media. Be the family that doesn't comment on weight. Comment on energy, on capability, on what her body can do, not on how it looks. That single shift protects against more disordered eating than any nutrition lecture will.
Final thoughts
A height and weight chart for girls is a tool, not a verdict. It's most useful when it's read as a long-term trend rather than a moment-in-time judgement, and least useful when it's used to compare one child to another. Every girl grows on her own curve — shaped by genetics, nutrition, hormones, sleep, activity and an enormous amount of biological variation no chart can capture.
If you ever find yourself worried about your daughter's growth, the first call is to her paediatrician — not to Google, not to a clinic, not to social media. If the concern is dermatological — puberty acne, stretch marks, pigmentation, hormone-linked skin issues — our team at VK Allure Dermaclinic sees teenagers and young women across both Chennai branches every week. We don't replace paediatric or gynaecological care; we sit alongside it.
Growing daughters need three things from the adults around them: accurate information, honest reassurance and timely action when something genuinely needs attention. That's what this guide tries to be.